
January 2017 Report
Gold, Google, Facebook & San Francisco Homes
Return on Investment Rates since 2011
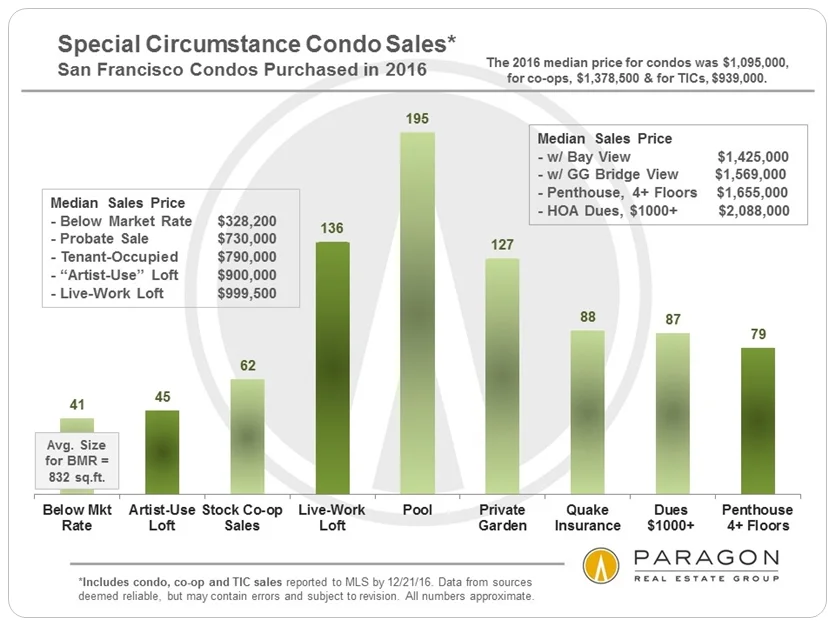
Penthouses, Probates, Fixer-Uppers & Panoramic Views
A Survey of the SF Real Estate Market in 2016

This first chart is a somewhat lighthearted, but we believe accurate look at how various 2011 investments would have played out through 2016. (FB is dated from its 2012 IPO.) When calculating appreciation, purchase and sale dates are critical factors, and changing those can alter the results significantly: Using 2011, the last bottom of the real estate market, as the purchase date certainly plays to the advantage of home price increases. If you bought gold or soybeans in 2011, you really should have sold them a couple years ago at the height of the commodity price boom.
Besides the appreciation percentage noted, buying a home in 2011 with all cash would have generated large, additional financial returns in the form of extremely low monthly housing costs. Buying it with 20% down supercharges the return on cash investment, and that is before adding in other advantages: Even with an 80% loan, by 2016 your monthly housing costs, with recent low-interest rates and tax advantages, would be well below market rents. Then there is the huge capital gains exclusion on the sale of a primary residence, which would not apply to other investments.
Sales of Probates, Penthouses, Fixer-Uppers, Lofts;
Homes with Views, Elevators & Wine Cellars

Long-term San Francisco
Median Home Price Appreciation


San Francisco median house prices continued to appreciate in 2016, albeit, at 6%, at a considerably slower rate than the previous 4 years, while condo prices basically plateaued (and indeed dipped in some neighborhoods). As with almost everything to do with real estate values, it boils down mostly to supply and demand, as discussed below.


In 2016, the supply (and sales) of house listings in the city continued to dwindle, while a surge of new construction condo projects hitting the market appreciably increased the inventory of condos available to purchase. In 2003, house sales in San Francisco were over 50% higher than in 2016. According to a study by the National Association of Realtors, the median time house owners are staying in their homes has jumped from an average of 6 years in 1987-2008 to 9 years since: Owners are getting older, not changing jobs as often, and baby boomers are aging in place as NAR put it. House owners sell their homes much less frequently than condo owners, who tend to be younger. In SF, there is also the factor of a reluctance to sell when that means facing a very challenging market for buyers. And with very low-interest rates and very high rents, some owners are renting out their houses instead of selling.
It all boils down to a continuing strong demand for houses meeting a steadily declining supply: Even with a market that cooled somewhat in 2016, competition between buyers continues to push house prices up, especially in more affordable neighborhoods. The equation is different for condos, which has become the dominant property-sales type in the city: A cooling market is meeting increased supply. There has been no crash in condo prices, but areas with the greatest quantity of new condo construction have seen small declines.
What Costs How Much Where in San Francisco
Below are a few of our many updated analyses on home sales and prices by neighborhood, property type and bedroom count.
House Sales & Values


As can be seen above, two of the most affordable districts for houses, Districts 10 and 2, also provide 37% of all the house sales in the city. Generally speaking, they have continued to experience very strong buyer demand in 2016.
Condo Sales & Values


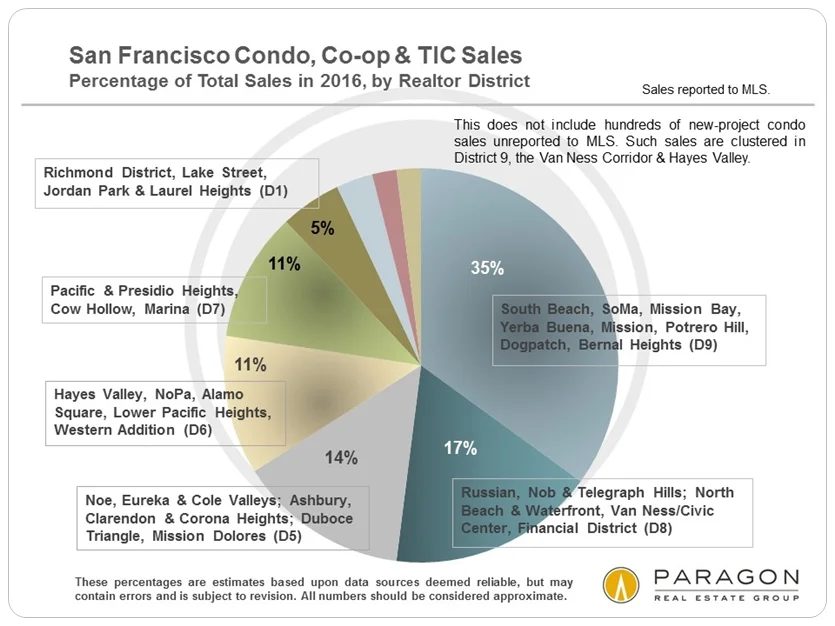
District 9, a large district that stretches from SoMa, South Beach and Mission Bay to Potrero Hill, Dogpatch and Inner Mission, is increasingly dominating condo sales in the city. The great majority of new condo construction, especially of the largest projects, has been occurring in this district.
Home Sales by Price Segment by District
Behind the overall median prices often quoted is a wide range of individual sales across a spectrum of prices. Here are a few of our updated analyses for every district of the city.


San Francisco Overview Market Statistics
The following classic measures of market heat all tell the same story: Coming out of the recession in 2011, the San Francisco market became increasingly frenzied through the spring of 2015. In late 2015, as housing affordability became a critical issue, and the local high-tech economy saw some cooling, and financial markets worldwide experienced increasing volatility, the SF real estate market began to cool and normalize. Buyer competition for new listings softened, overbidding declined, days-on-market increased, appreciation declined or plateaued, and so on. And the condo market cooled more than the house market due to issues discussed above.
2016 saw a reasonable adjustment to a desperately overheated market, but nothing that suggests, so far, an imminent, dramatic downturn. Indeed, by national standards, most of our current statistics still define a relatively robust market. In a recent interview, Ted Egan, chief economist of the City of San Francisco, put the odds of a new recession at 10% or less.


Real Estate Market Seasonality
Listing and sales activity builds from early January, the nadir of the market, into spring, typically the most active season. Accepted-offer activity provides an excellent illustration of the heat of the market during different times of the year.

3 Important Economic Indicators
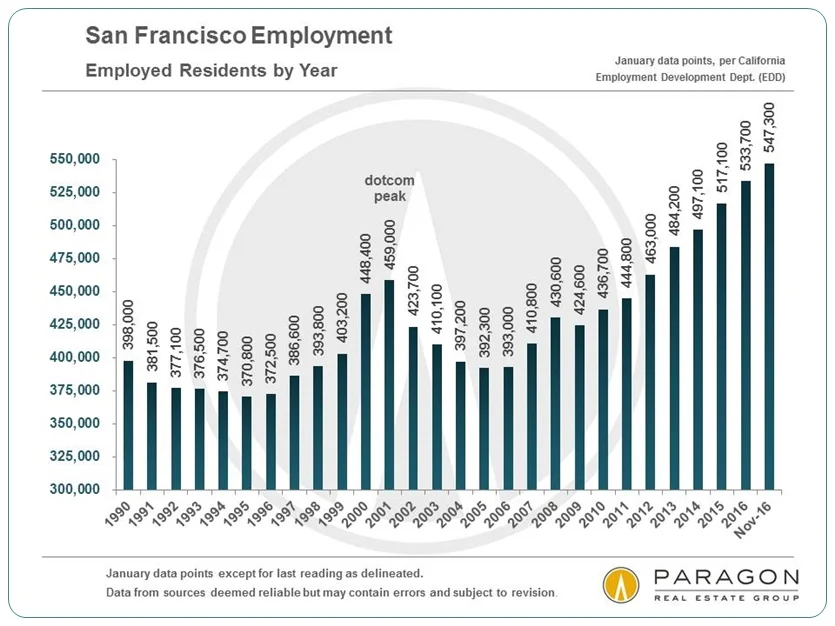
San Francisco & Bay Area Employment Trends
After dropping a little in the first half of 2016, SF and Bay Area employment numbers jumped back up in the second half, an encouraging sign for the local economy.

Mortgage Interest Rates in 2016
Interest rates popped 22% higher since the election, though they still remain very low by any historical measure. Where they will go now is a subject of intense speculation since they are a critical component of housing affordability.

The S&P 500 Stock Index since 1994
To the surprise of many, U.S. stock markets also popped after the election to their highest points ever.

Market report courtesy of www.paragon-re.com
It is impossible to know how median and average value statistics apply to any particular home without a specific comparative market analysis, which we are happy to provide upon request. Please call or email if you have any questions or need assistance in any way.
These analyses were made in good faith by Chief Marketing Analyst, Patrick Carlisle, with data from sources deemed reliable, but may contain errors and are subject to revision. It is not our intent to convince you of a particular position, but to attempt to provide straightforward data and analysis, so you can make your own informed decisions. Median and average statistics are enormous generalities: There are hundreds of different markets in the Bay Area, each with its own unique dynamics. Median prices and average dollar per square foot values can be and often are affected by other factors besides changes in fair market value. Longer term trends are much more meaningful than short-term.