Marin Median Home Prices
Reflecting MLS Sales in 2016
Mouse over map for median price icons

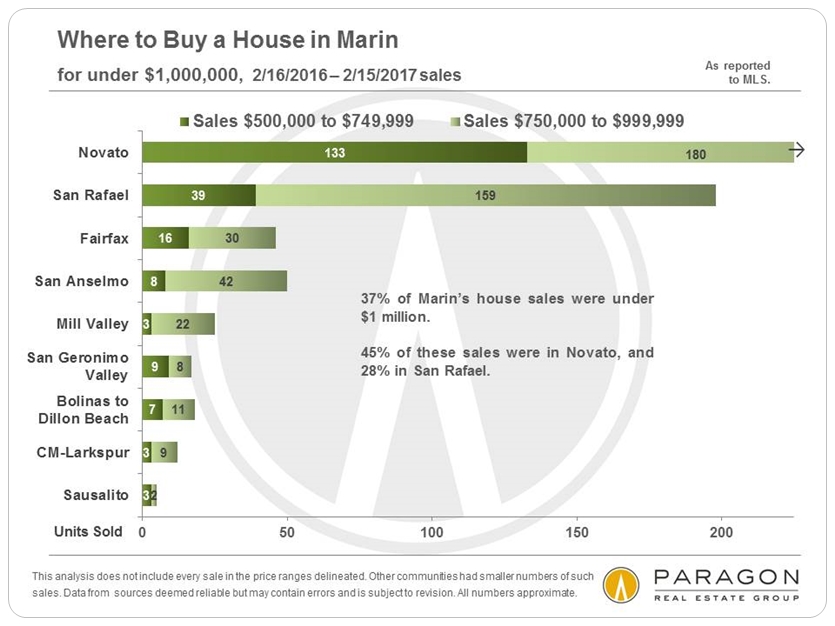
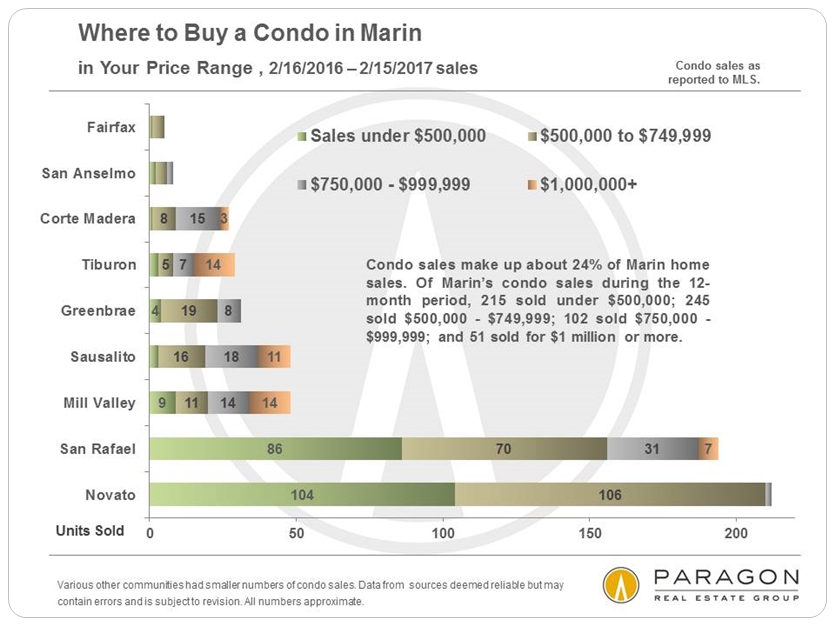
Where to Look to Buy for the Price You Want to Pay
The county market for houses under $1,000,000 and for condos is dominated by San Rafael and Novato, by far the biggest cities in Marin. Moving into higher price ranges brings other cities into the picture, notably Mill Valley, San Anselmo and Corte Madera. And in the luxury home market, $2 million and above, Mill Valley, Tiburon and Kentfield become the sales leaders. Some of the most expensive home markets have very small numbers of sales in any given year.


What Can I Buy for $1,200,000 or $2,000,000?
Below are illustrations of the wide range of homes one might buy at two different price points in Marin. The higher the column, the greater the square footage of the home. (Note that the bathroom specifications can be a little screwy, for example 2.3 or 1.7 baths, because these are averages of homes sold at these approximate price points.) Since these charts cannot factor in a great many criteria for value, such as condition, attractiveness, decks, gardens, extra parking, views and so on, they are very general takes on the markets around the county.
For $1,200,000, in 2016, one could have purchased a 4-bedroom, 3060 square foot house in Novato, or a 3-bedroom, 1847 square foot house in Mill Valley, or a 1266 square foot cottage in Tiburon.

As mentioned, many of the highest end home markets in Marin are quite small, so when looking at this specific price point in a particular town, sometimes only one sale came up. However, the sales still give an idea of the wide range of homes one could have purchased in different areas of the county for $2 million, from very large houses on acreage in some places, to a 1 BR house in Belvedere and a major fixer-upper in Ross.

Market Summary
January and February constitute the slowest sales months of the year and are subject to significant seasonal issues - many of their sales went into contract in December - so coming to definitive conclusions about where the market is heading based on their data is difficult. However, for what it is worth, comparing the 2-month period of 2017 to the same period a year ago, the median house sales price in Marin, at $1,125,000 was 2.5% higher. General inventory levels remain quite low when compared to demand, except in the luxury segment where demand appears to have softened over the past year while the number of listings for sale has ticked up.
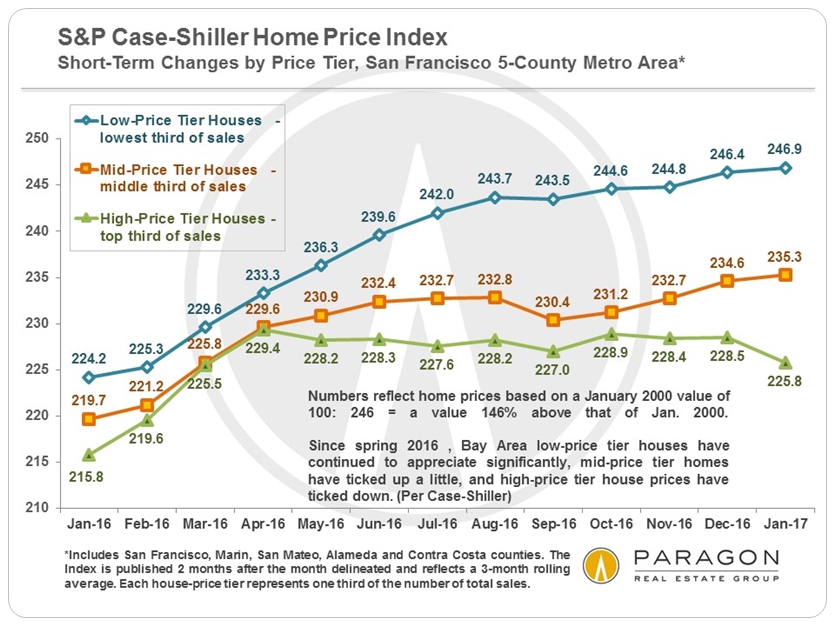
This chart below reflects the latest Case-Shiller Home Price Index for the 5-county metro area house market, going through the end of 2016. It illustrates how in 2016, more affordably-priced houses continued to appreciate significantly, while the most expensive segment basically flattened. Generally speaking, this is a common dynamic around the Bay Area.
Selected Market Dynamics Snapshots
For the most part, these statistical angles on conditions and trends indicate a general stabilizing in the market, 2015 to 2016, with some hints of cooling from the considerable heat of recent years. Most of the following charts show the changes in the market as the recovery began in 2012 and through to 2016.
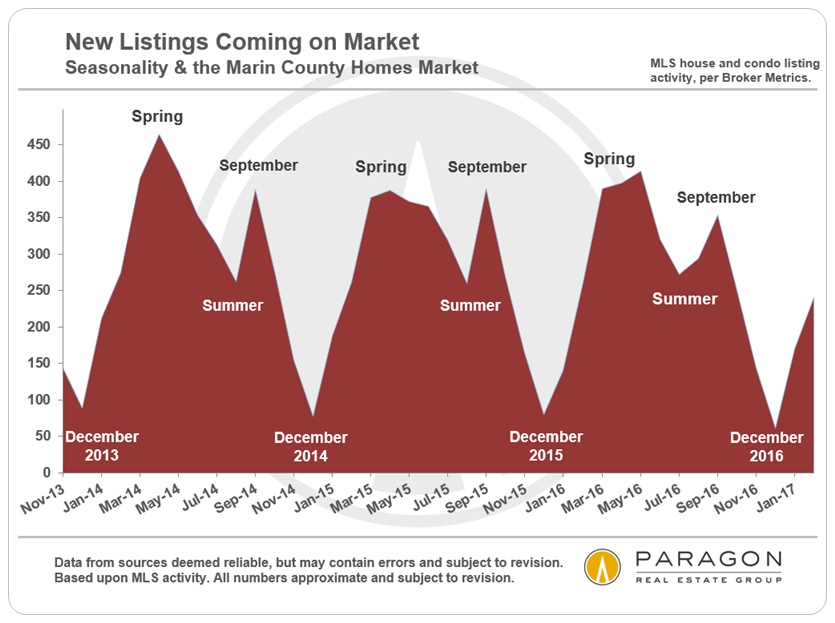
New Listings Begin Pouring onto the Market Again
The period from March through June is usually the most active selling season of the year, and we will soon have more conclusive indications of where the 2017 market is headed. This next chart illustrates the dramatic surge of new inventory that starts in February and fuels sales during this period.
Average Days on Market

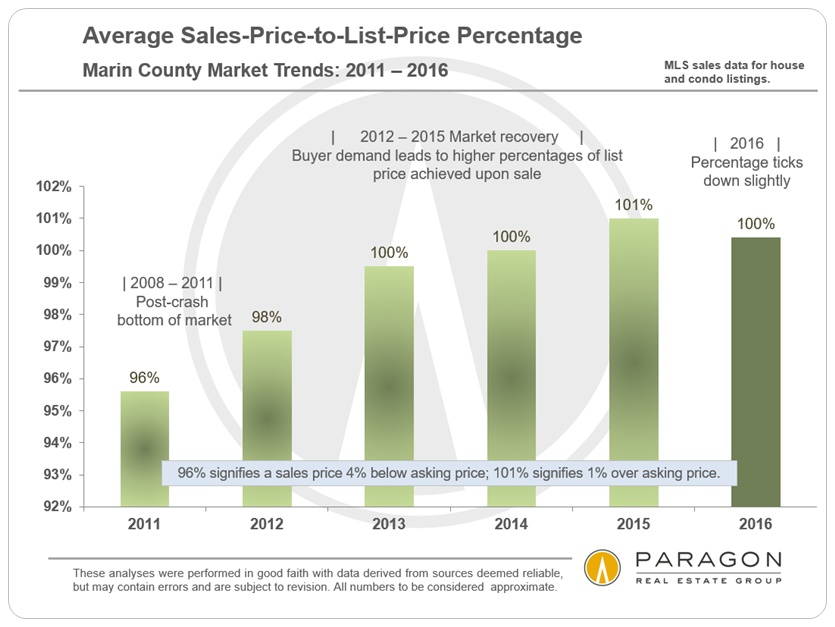
Average Sales Price to List Price Percentage
Percentage of Sales Accepting Offers within 30 Days
The hotter the market, the greater the percentage of sales that happen quickly, and the higher the percentage of sales price to asking price for the new listings snapped up. In 2016, both of those measurements declined a little but still remained high by any historical standard.

Listings Expiring or Withdrawn (No Sale)
A significant increase in listings expiring or being withdrawn without selling can signal a growing disconnect between what sellers believe their properties are worth and that price buyers are willing to pay. Though there was a small increase in 2016 in these no-sale listings, the number still compares very well with previous years when the market was quite strong. It will be a statistic to watch as the new year develops.
The gap between the median sales price of homes selling ($1,195,000) and the median list price of homes not selling ($1,792,500), at almost $600,000, suggests either the market is becoming saturated with more high-end listings than can be absorbed, or that overpricing is becoming a more serious issue.

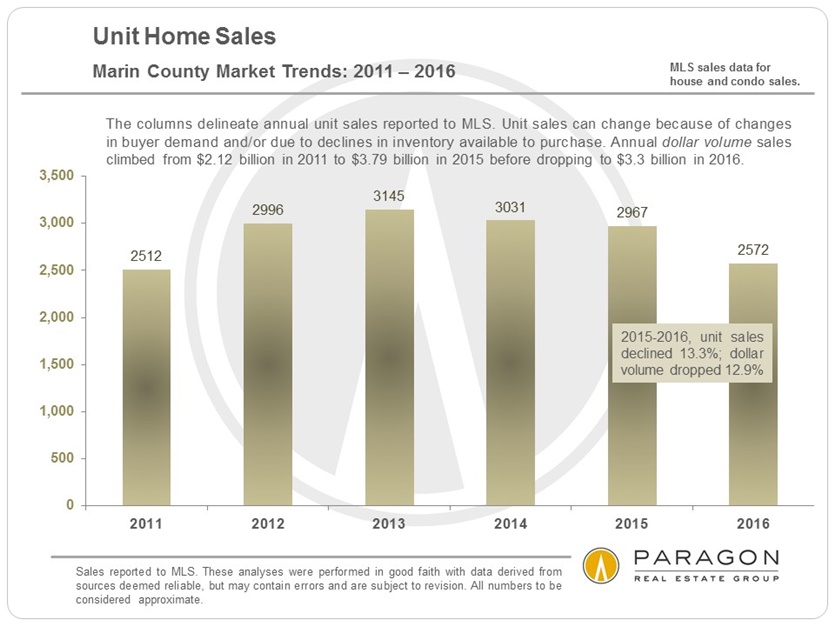
Unit Sales Volume
Drops in sales volumes can occur for totally different reasons: A decline in demand, as occurred after the financial markets crash in 2008, or a decline in the number of listings available to purchase, or some combination of the two. This is another dynamic to keep a close eye on in 2017. However, it should be noted that as sales volume dropped in 2016, the overall median sales price increased about 8% from 2015, though, as mentioned previously, appreciation has varied by price segment.
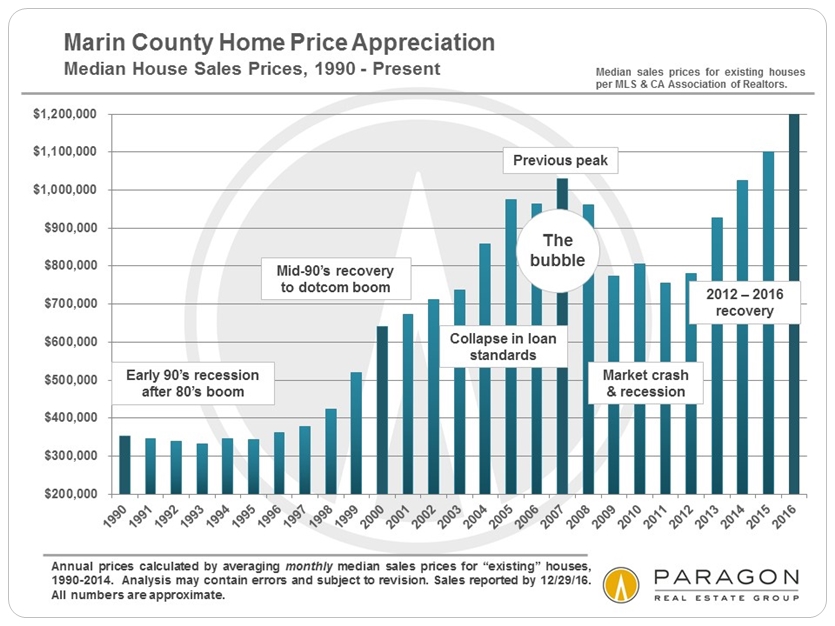
The chart below is specific to the Marin County market, illustrating median house price movements since 1996. All parts of the Bay Area saw similar trends, though the percentages up and down varied between markets.

It is interesting to note that the year of highest percentage appreciation in the past 25 years was 2000, the height of the dotcom bubble, and not in our most recent boom. This is consistent across all the markets we have tracked in the Bay Area. However, by dollar appreciation, as opposed to percentage change, following years have seen by far the greatest increase in prices.
Gold, Google, Soybeans
& Marin Home Price Appreciation
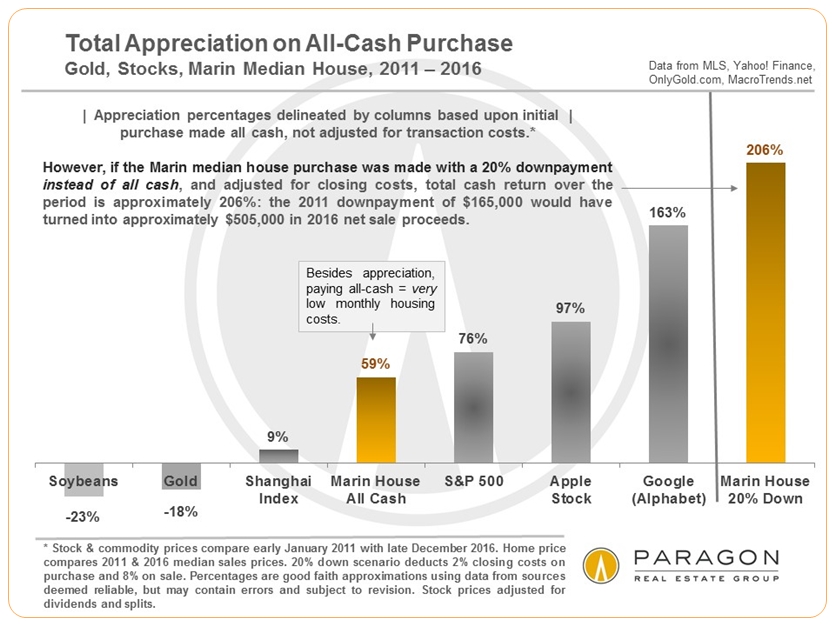
This chart above is a somewhat lighthearted, but we believe accurate look at how various 2011 investments would have played out through 2016. When calculating appreciation, purchase and sale dates are critical factors, and changing those can alter the results significantly: Using 2011, the last bottom of the real estate market, as the purchase date certainly plays to the advantage of home price increases. If you bought gold or soybeans in 2011, you really should have sold them a couple years ago at the height of the commodity price boom.
Besides the appreciation percentage noted, buying a home in 2011 with all cash would have generated large, additional financial returns in the form of extremely low monthly housing costs. Buying it with 20% down supercharges the return on cash investment, and that is before adding in other advantages: Even with an 80% loan, by 2016 your monthly housing costs, with recent low interest rates and tax advantages, would be well below market rents. Then there is the huge capital gains exclusion on the sale of a primary residence, which would not apply to other investments.
Long-term Marin Median Home Price Appreciation
What Costs How Much Where in Marin
Sales & Prices by City and Home Size


2016 Home Sales by Price Point
in Southern, Central & Northern Marin


Marin 2016 Luxury Home Sales by City

Appreciation by City & Town


Real Estate Market Seasonality
Listing and sales activity builds from early January, the nadir of the market, into spring, typically the most active season. Accepted-offer activity provides an excellent illustration of the heat of the market during different times of the year.

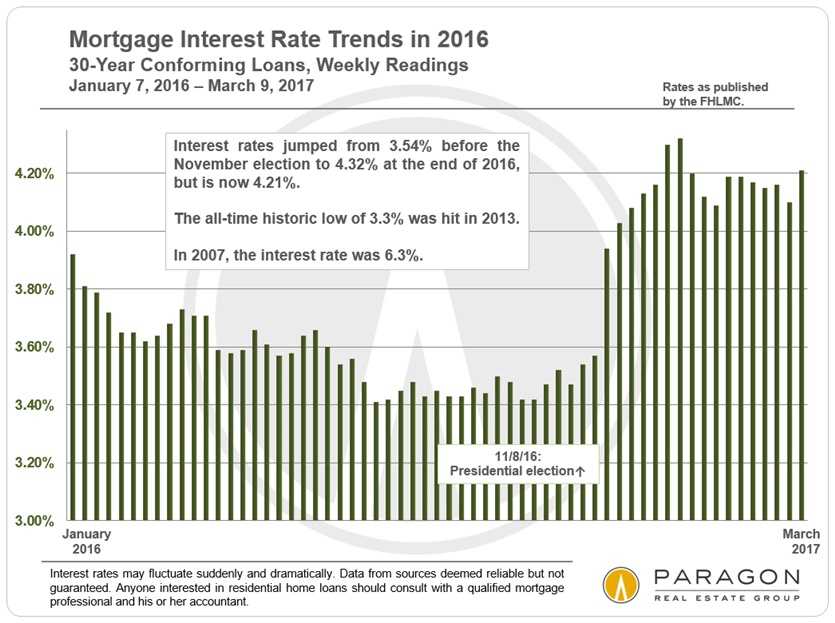
Mortgage Interest Rates

Bay Area Real Estate Cycles since 1984 per the S&P Case-Shiller Home Price Index
The first chart below is a simplified graph based on the Case-Shiller Home Price Index illustrating percentage increases and decreases in prices for Bay Area houses in the higher-price tier. The markets in Marin, San Francisco and San Mateo are generally dominated by high-price-tier home sales.
All the short-term fluctuations up and down have been removed so that the chart only reflects major turning points in the market. This chart is a general overview for 5 Bay Area counties, and there have been significant variations between market trends in different neighborhoods, cities and counties. The Case-Shiller Index does not measure appreciation by changes in median sales price (as in the second chart below), but uses its own special algorithm, which it believes better reflects actual changes in the fair market value of specific properties over time.

It is very important to note that just because market cycles have generally played out in certain ways and on similar timelines over the past 30-odd years does not make it certain they will follow the same pattern in the future.
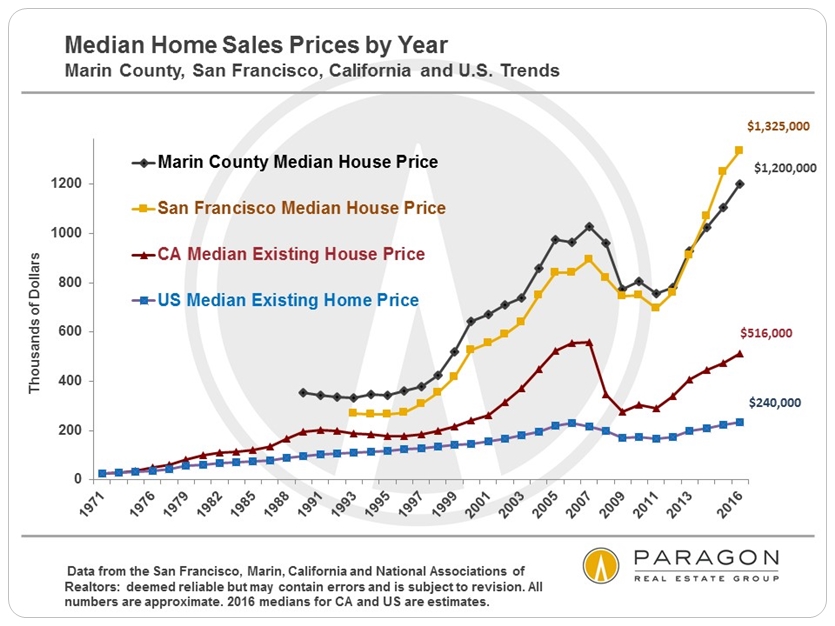
Median Sales Price Trends by Year
Marin, San Francisco, California & U.S.

2016 Overview Statistics for Marin
County Cities & Towns


Annual Changes in Home Values
Average Dollar per Square Foot & Median Sales Price
Below are charts that first measure year-over-year changes in average dollar per square foot values and then changes in median sales prices in Marin County. Neither of these common measurements is a perfect indicator of changes in fair market value, because both can be affected by a variety of factors to create fluctuations. It sometimes happens that over the same period of time, one metric of value goes up, while the other goes down, delivering contradictory indications of market appreciation trends. For example, this occurred in Belvedere, Ross and Tiburon over the past year. This is sometimes due to the fact that the average size of the homes sold changed considerably, but other factors can apply as well.
All things being equal, a smaller house will sell for a lower sales price but a higher dollar per square foot value than a larger one. (This has to do with lot values and the costs of kitchens, baths and central systems.) And vice versa: a larger house will sell for a higher sales price but lower dollar per square foot. In the most expensive communities of Marin, swings in average size can be quite large.
This is a useful reminder that these statistics are not perfect, but simply generalizations and approximations of conditions and trends. When an area suddenly sees an unusually large increase or decline in median sales price or average dollar per square foot, it may well have to do with special factors being at play. In real estate, the devil is always in the details.
Average Dollar per Square Foot Values
2012 – 2016


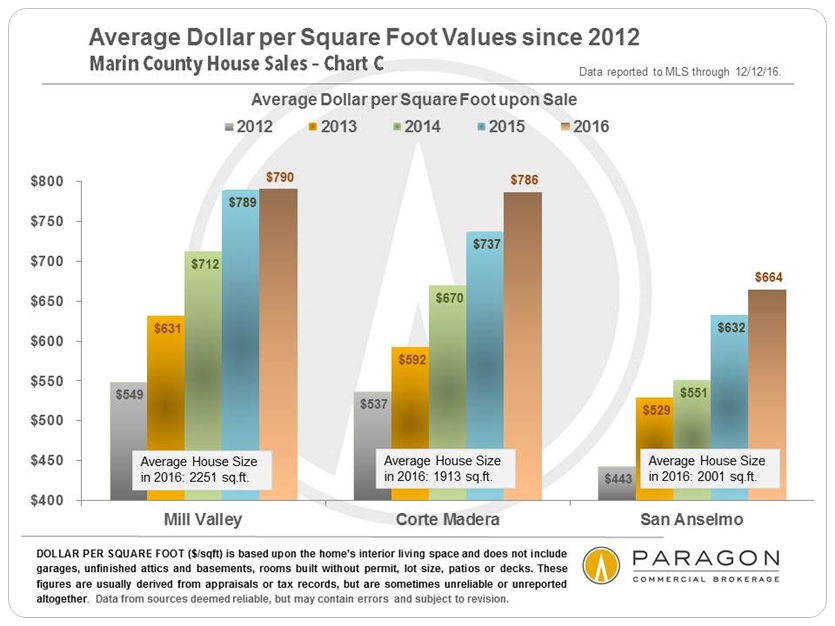
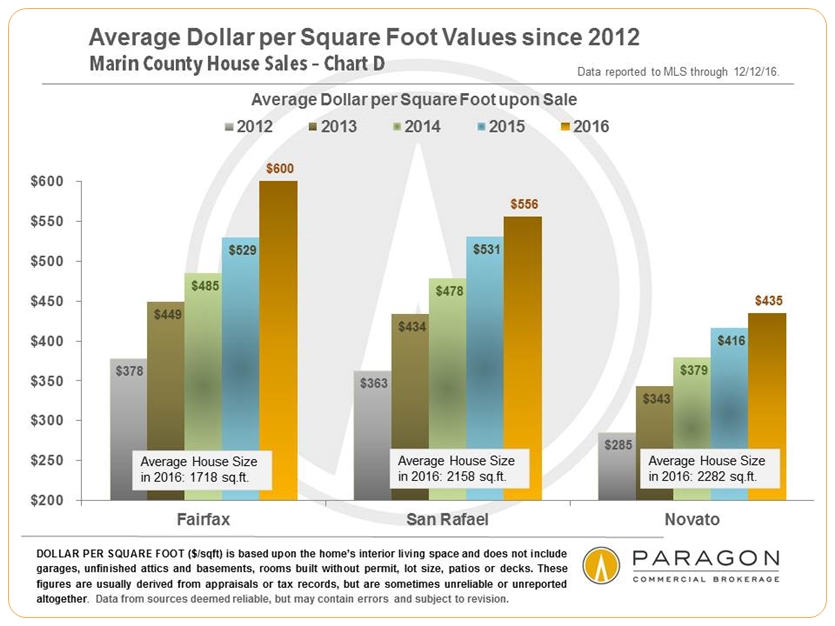
For a little further context, the average dollar per square foot value for houses in San Francisco ranges from $600 to $1500 depending on the neighborhood: Pacific Heights has the highest value.
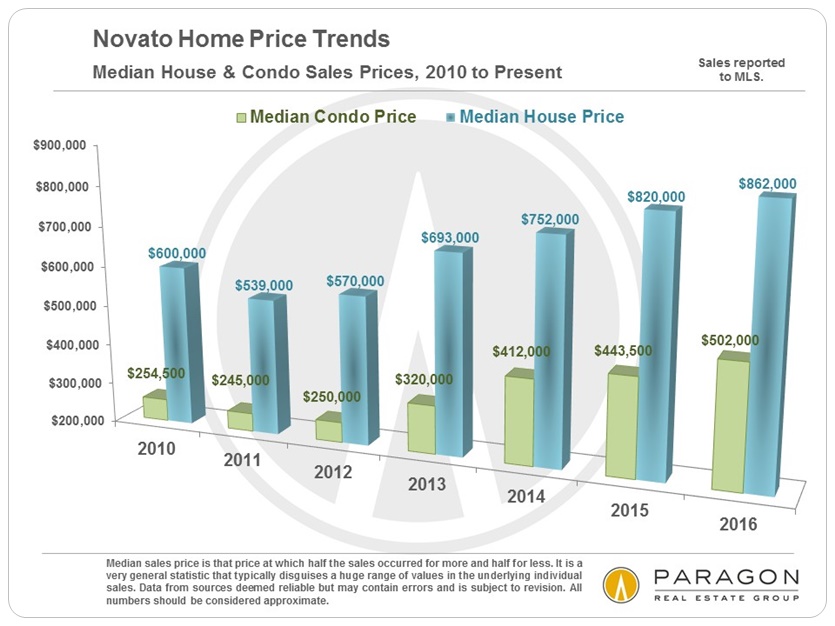
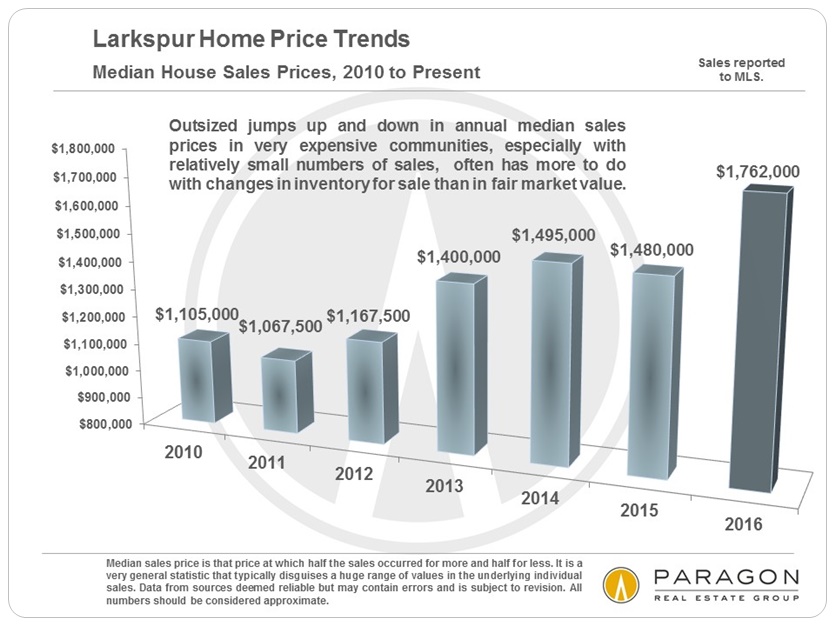
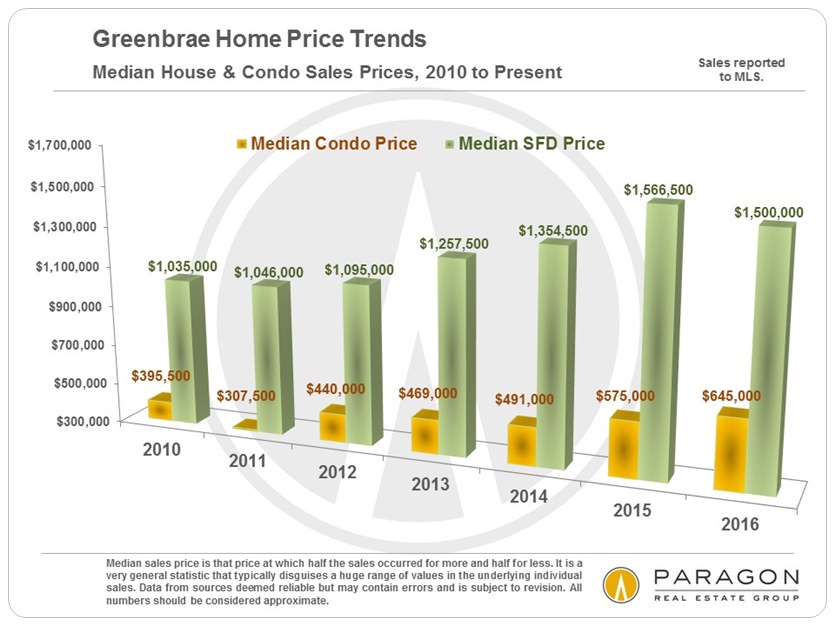
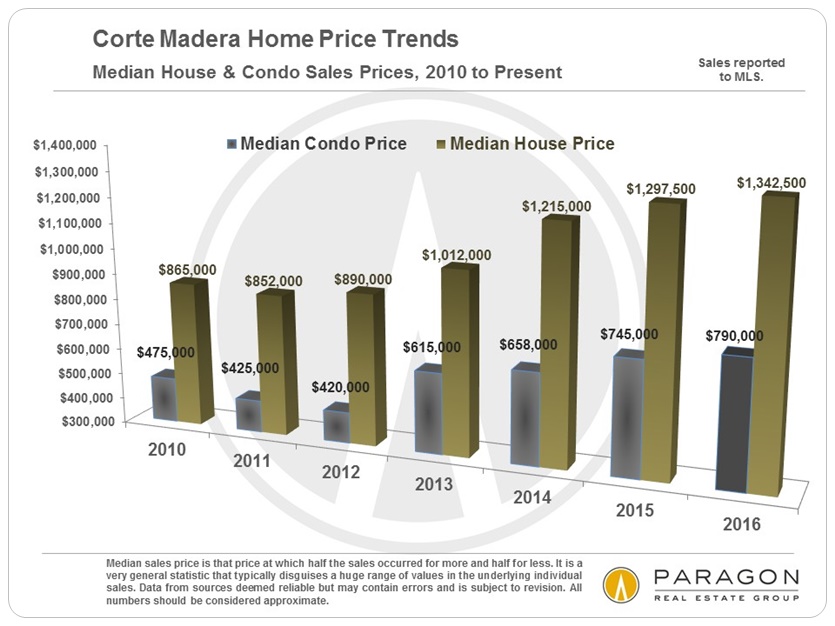
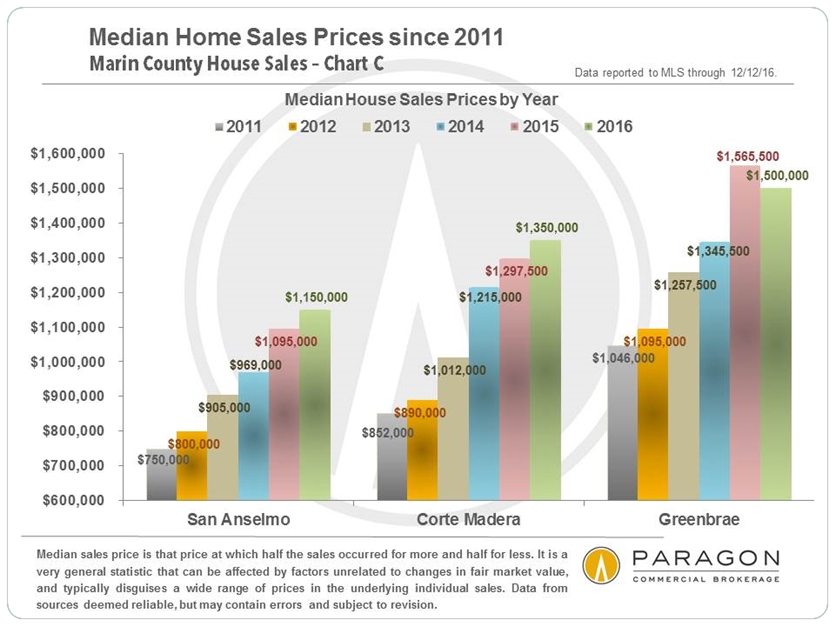
Median House Price Trends since 2011
Median sales price is that price at which half the sales occurred for more and half for less, and often disguises a huge range of sales prices in the individual underlying sales. It can be and often is affected by other factors besides changes in fair market value, for example, as mentioned above, by significant changes in average house size.
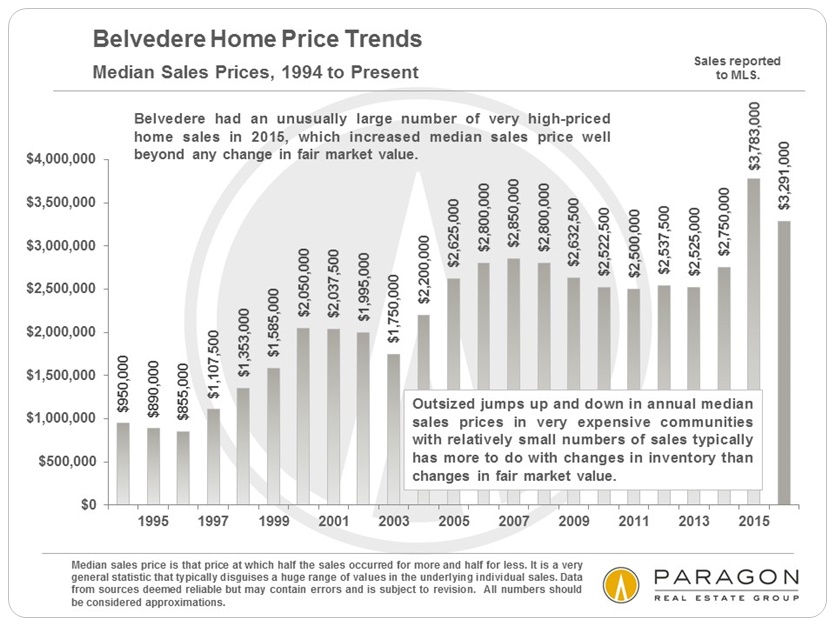
The city of Belvedere is not included in the charts below. It has relatively few sales, and can see an enormous range in sales prices: Its annual median sales price bounces up and down simply due to the specific houses selling in any particular year. The median price in Belvedere, as reported to MLS in 2016 YTD, was $3,370,000, but in 2015, it surged to $3,891,500.


Market report courtesy of www.paragon-re.com
It is impossible to know how median and average value statistics apply to any particular home without a specific comparative market analysis, which we are happy to provide upon request. Please call or email if you have any questions or need assistance in any way.
These analyses were made in good faith by Chief Marketing Analyst, Patrick Carlisle, with data from sources deemed reliable, but may contain errors and are subject to revision. It is not our intent to convince you of a particular position, but to attempt to provide straightforward data and analysis, so you can make your own informed decisions. Median and average statistics are enormous generalities: There are hundreds of different markets in the Bay Area, each with its own unique dynamics. Median prices and average dollar per square foot values can be and often are affected by other factors besides changes in fair market value. Longer term trends are much more meaningful than short-term.